Raisin River Results and Oulier Impact/Exclusion
Module
Please note that these materials have not yet completed the required pedagogical and industry peer-reviews to become a published module on the SCORE Network. However, instructors are still welcome to use these materials if they are so inclined.
Introduction
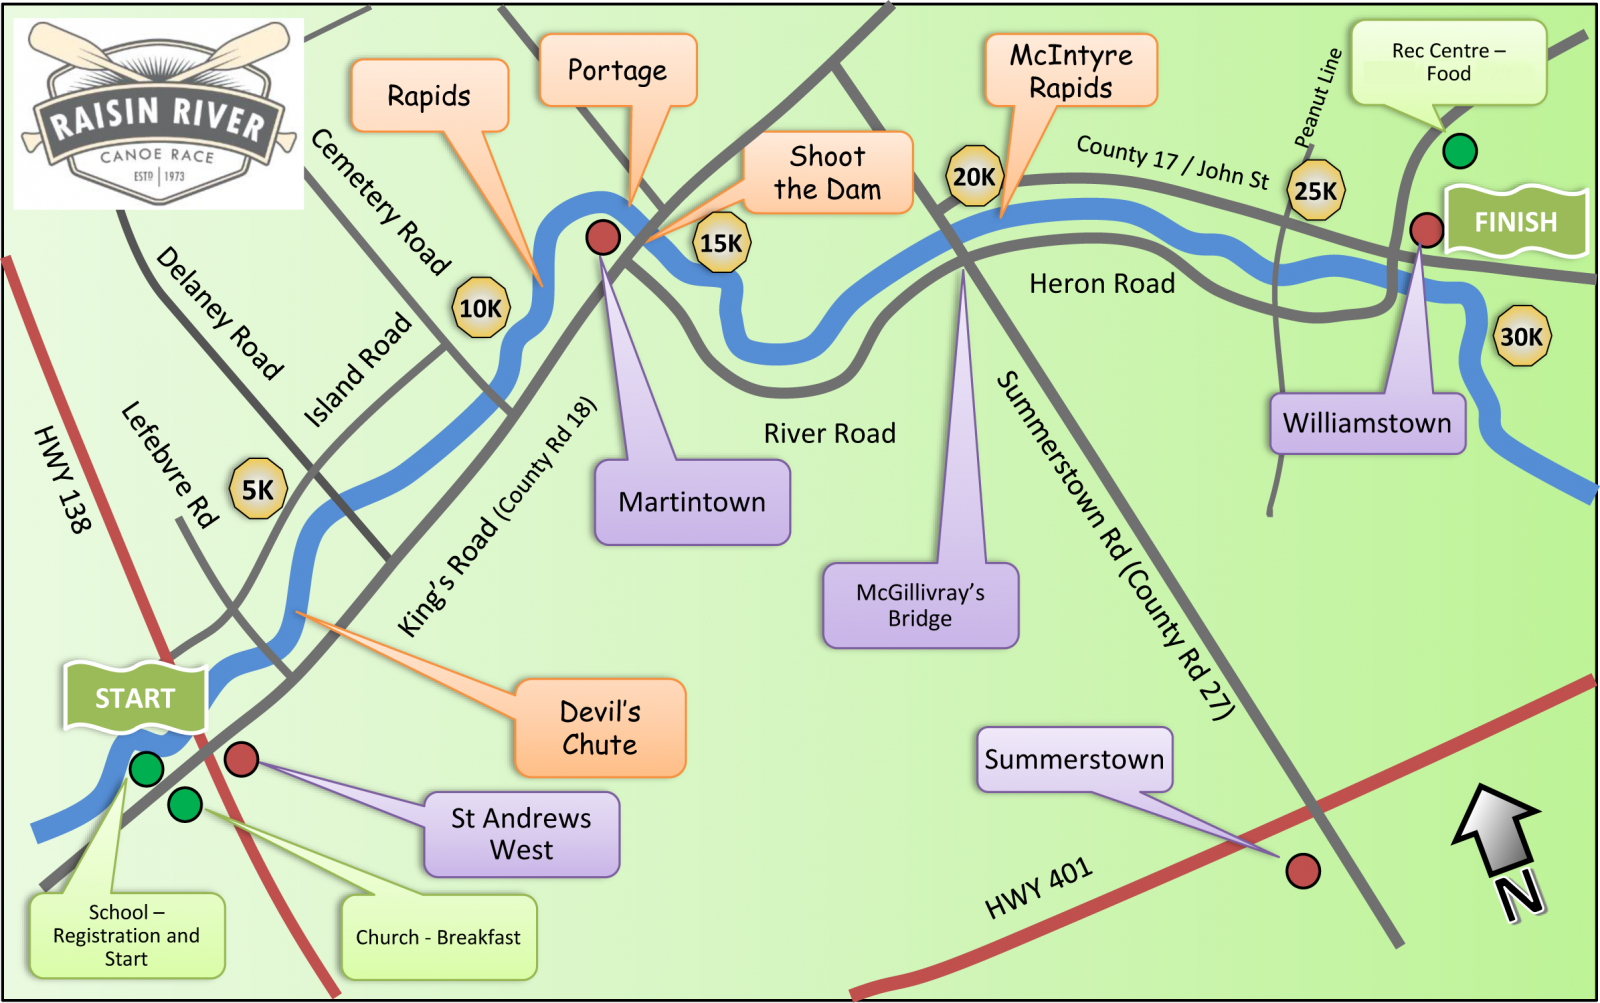
Each year, the Raisin Region Conservation Authority (RRCA) holds the Raisin River Race. This race is one of the longest races in Eastern Ontario, spanning almost 19 miles (30 km) on the Raisin River, from St. Andrews West to Williamstown. Paddlers compete against each other to achieve the fastest time in their class. Classes vary by the years and are split up based on boat type and paddler/s.
The Raisin River Race can be paddled by canoes or kayaks, but stand-up paddleboards are not permitted.
Background Video
For those interested in learning more about canoe racing, watch this informative and humorous video from AuSable River Canoe Marathon competitor Holly Reynolds - “I am a canoe racer, explaining canoe racing.”
Data
This activity uses the data set: raisin_river_DNF.csv
The raisin_river_DNF.csv data set includes data from Paddlestats and the Raisin River Race website about the Raisin River Race from the years 2015-2025 (excluding 2020 and 2021 as no race was held due to the COVID-19 pandemic and 2019 due to incomplete finish status data). Each row contains the year, the flow from that year, and the proportion of DNFs from that year (calculated by dividing number of DNFs by total number of participants).
Variable Descriptions
| Variable | Description |
|---|---|
| year | Year of Raisin River Race |
| prop_DNF | Proportion of boats that did not finish (DNF) the race. |
| flow | Flow of the water (indicative of water level) in ft^3/sec |
Data Source
The data are compiled from the Paddlestats Website and the Raisin River Race Website. This data set is a pared down version of the raisin_river_full.csv file from the SCORE Data Repository.